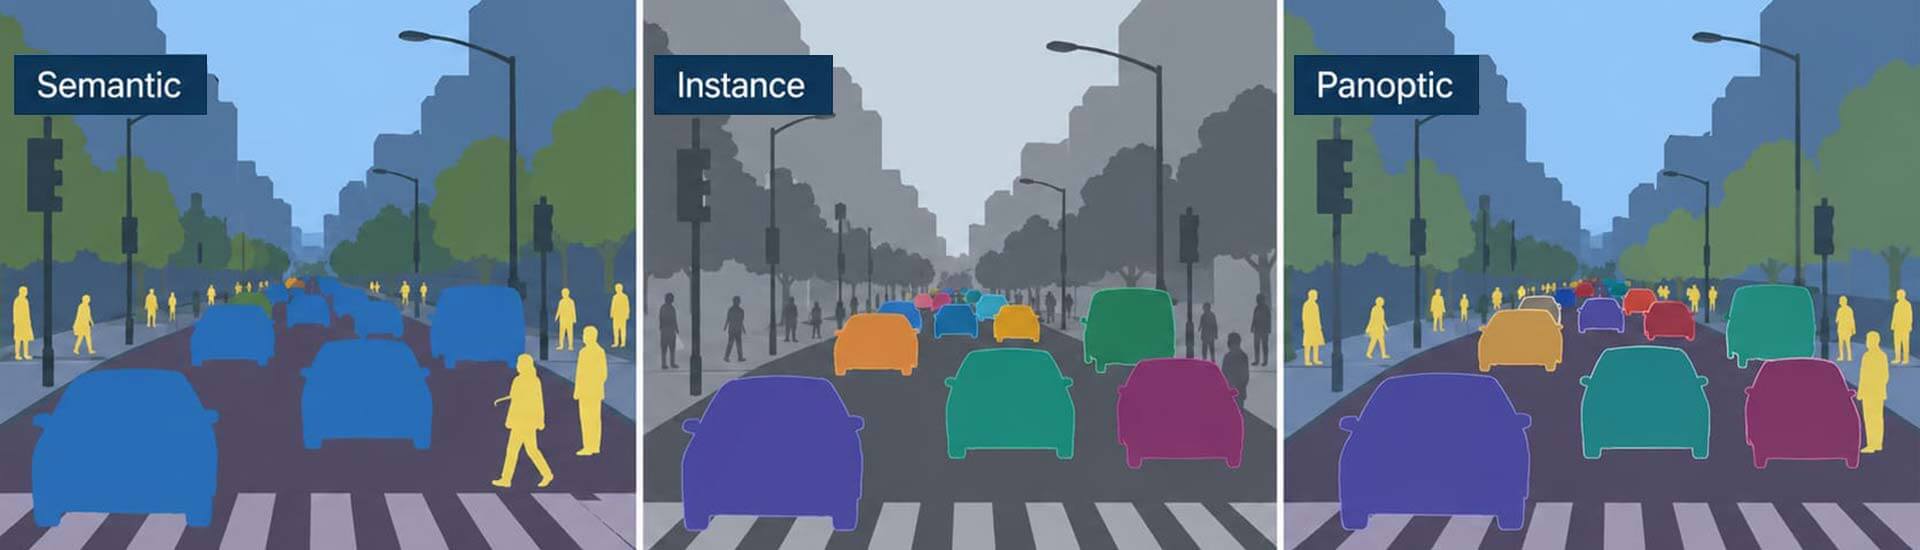
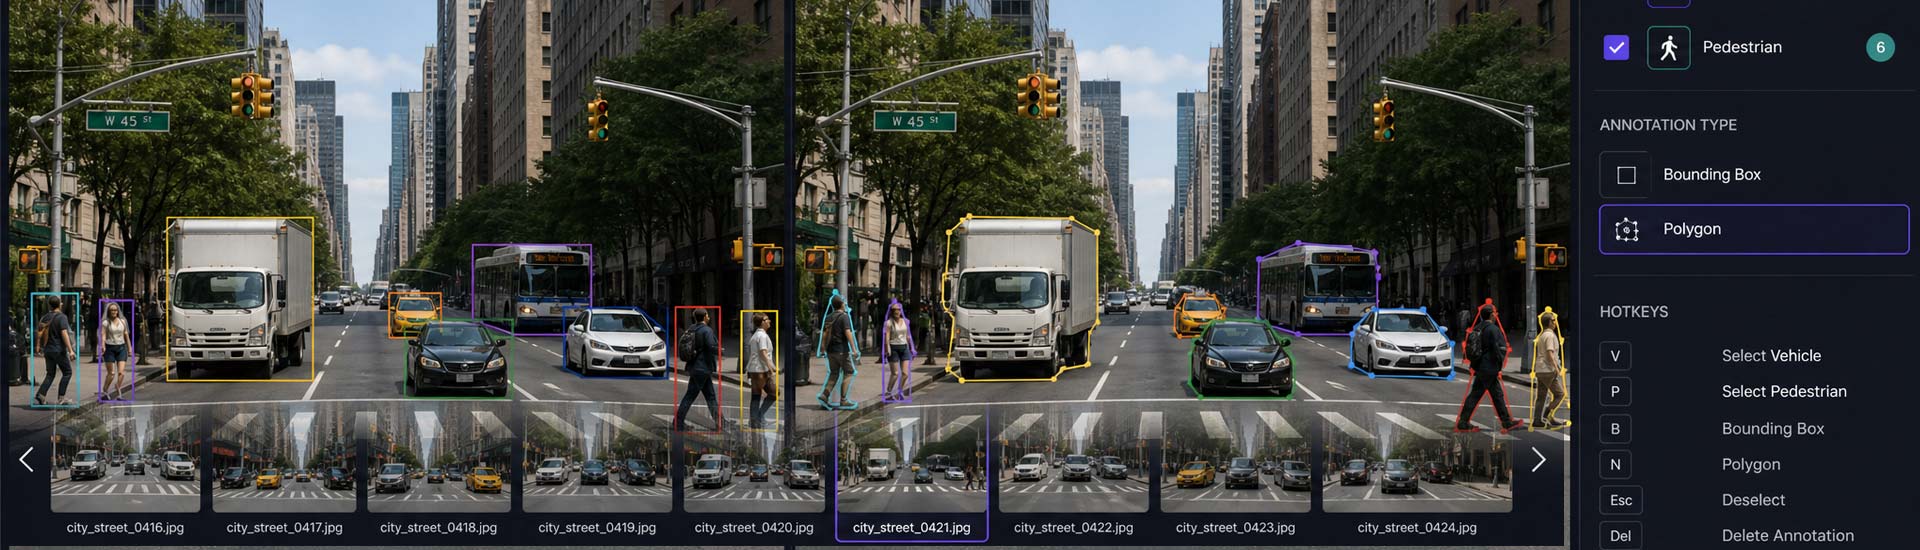
Bounding boxes and polygons are not cheap and premium versions of the same thing. A perfect box on a 3:1 object rotated 30 degrees caps out at 41% IoU. Polygons cost 4 to 8 times more, though model assistance narrowed that from 10 to 1. Box-supervised segmentation is the option most teams skip.
Table of Contents
- Quick Answer
- Segmentation vs Bounding Box Accuracy: What the Geometry Shows
- What Is Bounding Box Annotation in Object Detection?
- What Is Polygon Annotation in Image Segmentation?
- Polygon Annotation vs Bounding Box: Side-by-Side Comparison
- Annotation Cost Comparison: Why the 10-to-1 Gap Closed
- Box-Supervised Segmentation: Masks Without Polygon Labels
- When to Choose Bounding Box vs Polygon Annotation
- Hybrid Annotation Strategy: Combining Both Image Annotation Types
- Common Mistakes in Object Detection Labeling Projects
- Bounding Box vs Polygon Annotation Cost: A Worked Example
- Image Labeling Tools for Bounding Box and Polygon Annotation
- How HabileData Handles Bounding Box and Polygon Projects
- Bounding Box vs Polygon Annotation: The Short Version
- Bounding Box vs Polygon Annotation FAQs
Every few weeks someone sends me a dataset spec that says “polygon annotation” on 400,000 images, and when I ask what the model does, the answer is object detection. They are about to pay four to eight times more than they need to for labels the model will throw away.
The reverse happens too, and it costs more. A team boxes everything because boxes are cheap, then discovers six months in that their model cannot tell where an object ends, and the whole set needs relabeling.
Both mistakes come from treating this as a two-way choice. It stopped being one around 2023. Model-assisted labeling and box-supervised segmentation have quietly changed the maths, and most of the comparison content on this topic still describes the 2018 version of the trade-off.
So here is the current version, with the numbers I would actually use to scope a project.
Quick Answer
A bounding box is an axis-aligned rectangle drawn around an object, defined by four numbers, used to train detection models. A polygon traces the object’s actual outline with a series of vertices and is used to train segmentation models. Polygons capture shape that boxes cannot, and cost roughly 4 to 8 times more per object.
Segmentation vs Bounding Box Accuracy: What the Geometry Shows
Most comparisons say polygons are “more precise” and leave it there. You can put a number on it.
When you draw a perfect bounding box around an object, the box contains the object plus some background. Because the mask sits entirely inside the box, the IoU between that box and the object’s true extent is just the fraction of the box the object fills. That fraction is the accuracy ceiling of your annotation. No amount of annotator skill improves it, because the box is already perfect.
The fraction depends on two things: how elongated the object is, and how rotated it is relative to the image axes.
I worked these out analytically for idealized shapes. For a rectangular object of a given aspect ratio, rotated by a given angle, the figures are:
| Object aspect ratio | 0° (axis-aligned) | 15° | 30° | 45° |
|---|---|---|---|---|
| 1:1 (a box-shaped crate) | 100% | 67% | 54% | 50% |
| 2:1 (a car from behind) | 100% | 62% | 48% | 44% |
| 3:1 (a bus, a sofa) | 100% | 55% | 41% | 38% |
| 5:1 (a ladder, a surgical instrument) | 100% | 44% | 31% | 28% |
| 10:1 (a lane marking, a cable, a pole) | 100% | 28% | 19% | 17% |
| 20:1 (a power line, a crack in concrete) | 100% | 17% | 10% | 9% |
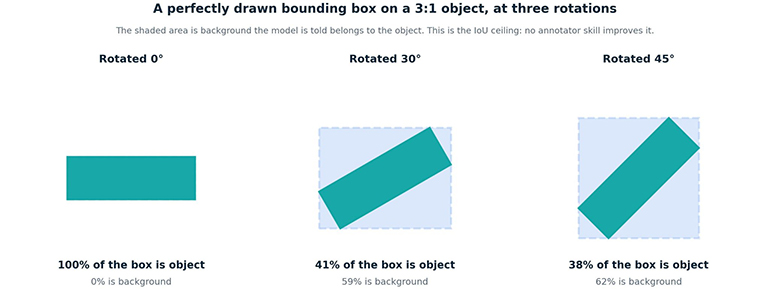
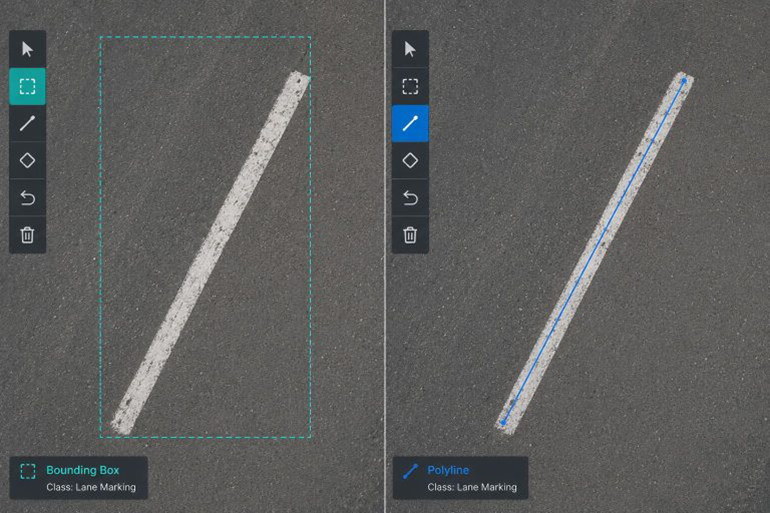
Look at the 10:1 row. A perfectly drawn box around a diagonal lane marking is 83% background. Your model is being told that 83% of those pixels belong to the object.
For rounded objects the axis-aligned case is worse. An ellipse fills 78.5% of its box no matter how you rotate it when it is circular, and a 5:1 ellipse at 45° fills 30%.
Three things fall out of this that matter when you are scoping a project:
Axis-aligned rigid objects are the best case for boxes, and it is a genuinely good case. A pedestrian standing upright, a car photographed from directly behind, a product on a white background, a face. The box is tight and the background fraction is small. Paying for polygons here buys you very little.
Rotation is the variable that gets underestimated. The same car costs you nothing at 0° and 52% of the box at 30°. Intersection footage, drone imagery, and warehouse ceiling cameras produce rotated objects constantly. Front-facing dash-cam footage produces far fewer.
Elongated and thin objects are where boxes stop working, full stop. Lane markings, cables, catheters, pipelines, crop rows, cracks, road edges. If your objects live in the bottom two rows of that table, the annotation type is not really a choice.
One caveat on the table: these are idealized shapes. Real objects are irregular, and a real annotator’s box is not perfect. Treat the numbers as a ceiling and an ordering, not a measurement of your dataset. If you want the actual figure for your data, compute mask area over box area on a few hundred labeled instances before you commit to a format.
What Is Bounding Box Annotation in Object Detection?
A bounding box is four numbers. Depending on your export format that is either corner coordinates (Pascal VOC XML), corner plus width and height (COCO JSON), or a normalized center point with dimensions (YOLO TXT).
Detection architectures consume it directly. YOLO26, Faster R-CNN, RT-DETR, and everything in that family predict boxes and classes, so box labels are exactly what the loss function needs.
Where boxes hold up well:
- The model only needs to answer “what is here and roughly where”
- Objects are compact and mostly axis-aligned
- You are counting, tracking, or triggering an alert rather than measuring
- Volume is high and per-unit cost is the binding constraint
- You need a first model in production quickly
Where they fail:
- Objects overlap heavily and boxes cannot separate them
- The downstream task needs area, boundary, or exact contact points
- Objects are thin, curved, or diagonal
- One box would contain most of another object
What Is Polygon Annotation in Image Segmentation?
A polygon is an ordered list of vertices tracing the object’s boundary. It feeds instance segmentation models like Mask R-CNN and the segmentation heads of the YOLO family, and it is the standard input for pixel-level tasks.
The vertex count is the cost driver, and it is worth knowing what real datasets look like. Analysis of COCO polygons published by Google researchers found an average of 24.5 vertices per instance, rising to 33.4 for large instances. That is the effort you are buying: two dozen deliberate clicks per object instead of two.
A detail that surprises people: polygon annotation quality is not automatically high. The COCO authors used a single annotator per instance to control cost, and researchers who later examined the boundaries found visible polygon artefacts and misaligned edges in the published masks. Paying for polygons does not buy precision by itself. It buys the opportunity for precision, and the QA process decides whether you get it.
Polygon Annotation vs Bounding Box: Side-by-Side Comparison
| Factor | Bounding box | Polygon |
|---|---|---|
| What it captures | Object location and rough extent | Object boundary |
| Annotation output | 4 values per object | 15 to 40+ vertex pairs per object |
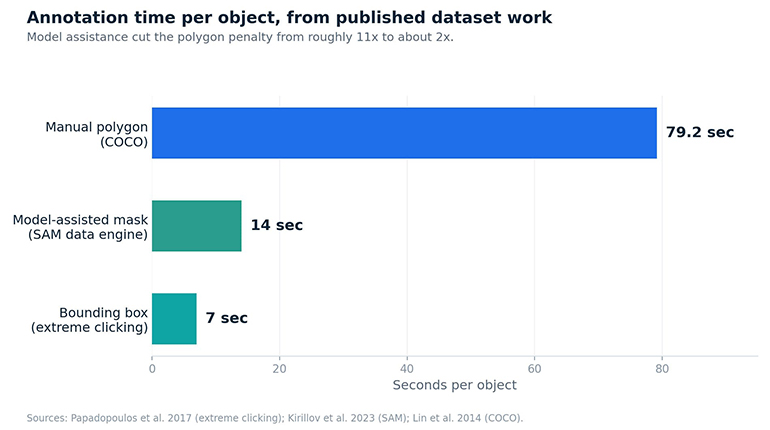
| Manual time per object | ~7 seconds with extreme clicking, ~35s drawn conventionally | ~79 seconds on COCO |
| Time with model assistance | Marginal gains | ~14 seconds with SAM-style tooling |
| Typical 2026 offshore rate | $0.03 to $0.12 per box | $0.10 to $0.80 per polygon |
| Model families | Detection: YOLO, Faster R-CNN, RT-DETR | Instance and semantic segmentation |
| Handles occlusion | Poorly; boxes overlap | Well, boundaries separate instances |
| Handles thin or diagonal objects | Poorly | Well |
| QA metric | Box IoU | Mask IoU, boundary IoU |
| Realistic QA threshold | 95%+ IoU | 93%+ IoU |
| Annotator training time | Hours | Days, plus domain calibration |
The time figures come from published dataset work rather than vendor estimates. Extreme clicking brought box annotation down to about 7 seconds per object, against roughly 34.5 seconds for conventional corner dragging. The COCO dataset required about 22 worker hours per 1,000 segmentations, which works out to 79.2 seconds per polygon.
Annotation Cost Comparison: Why the 10-to-1 Gap Closed
The old rule of thumb was that polygons cost roughly ten times what boxes cost. On pure manual drawing that was about right: 79 seconds against 7.
Model-assisted labeling broke that ratio. When Meta built SA-1B, annotators using SAM interactively brought the average down to 14 seconds per mask, which the team noted was 6.5 times faster than COCO’s manual polygon work and only about twice the cost of extreme-point box labeling. Their own annotation time fell from 34 seconds to 14 as the model improved during the project.
Two-to-one is a very different decision from ten-to-one.
This is why the tooling question is now part of the annotation-type question rather than separate from it. On our own projects, SAM and Labelbox MAL pre-labeling cut per-image time by 40 to 60% on structured datasets. That reduction lands almost entirely on the polygon side, because there is not much of a box to accelerate.
Where the ratio still holds is on data the foundation models handle badly. Medical imaging with low contrast boundaries, satellite imagery at unusual resolutions, microscopy, anything where “object” is ambiguous. Pre-labeling on that data can be slower than drawing from scratch, because correcting a wrong mask costs more than making a right one. Cityscapes is the cautionary number here: fine pixel-level annotation with quality control averaged more than 90 minutes per image, against under 7 minutes for coarse polygons on the same scenes.
Ask any vendor quoting you a polygon rate whether pre-labeling is included and what their acceptance rate on pre-labels actually is. If they cannot tell you, the rate is a guess.
Box-Supervised Segmentation: Masks Without Polygon Labels
Here is the part that changes budgets, and I almost never see it in vendor comparisons.
You can train segmentation models on box annotations. Not badly, either.
BoxInst reached 33.2 mask AP on COCO test-dev using no mask annotations at all, against 39.1 for the equivalent fully supervised model. Box2Mask later hit 38.3 mask AP with a ResNet-101 backbone, which beat fully mask-supervised Mask R-CNN at 35.7 on the same benchmark.
A model trained only on boxes outscored a model trained on polygons. That result is four years old now and I still meet teams who have never heard it.
That does not make polygon annotation obsolete. The gap reappears on boundary-sensitive classes, on thin structures, and on domains far from COCO’s distribution. Nobody should train a tumor segmentation model this way.
But it does mean the question “boxes or polygons?” has at least four answers, and the cheap ones deserve a pilot before you commit:
- Boxes only, detection model
- Boxes only, box-supervised segmentation model
- Model-assisted polygons, corrected by humans
- Hand-drawn polygons with multi-pass QA
Most teams I talk to jump from 1 to 4 without testing 2 or 3. On a 200,000-image project the difference between option 2 and option 4 is a five-figure sum and several weeks.
When to Choose Bounding Box vs Polygon Annotation
Run through these in order. The first “yes” usually settles it.
Does your loss function consume masks? If you are training a detector, polygons are wasted spend. Check the model, not the roadmap.
Do you need to measure something? Area, volume, coverage, contact area, defect size, crop yield. Boxes cannot give you these. Polygons can.
What is the aspect ratio and rotation profile of your objects? Pull the table above. If your objects sit in the top rows and mostly appear axis-aligned, boxes are close to lossless. Bottom rows, and you have no real choice.
Do objects occlude each other? Two overlapping boxes are ambiguous about which pixels belong to which instance. Two polygons are not. Dense retail shelves, crowds, cell imaging.
What does a boundary error cost? A recommendation engine mislabeling a handbag edge costs nothing. A surgical navigation system misjudging tissue boundary does not. Match the annotation spend to the consequence, not to the ambition.
Can you test box supervision first? If your domain is anywhere near natural images, run a pilot on option 2 before you buy 400,000 polygons.
Hybrid Annotation Strategy: Combining Both Image Annotation Types
The best-performing projects I have run rarely use one annotation type across the whole dataset. They stratify.
A common shape: box the entire dataset, then polygon a 10 to 20% subset chosen for the hard cases. Occluded instances, thin objects, the classes your model confuses. You get detection coverage at box economics and segmentation quality where it matters.
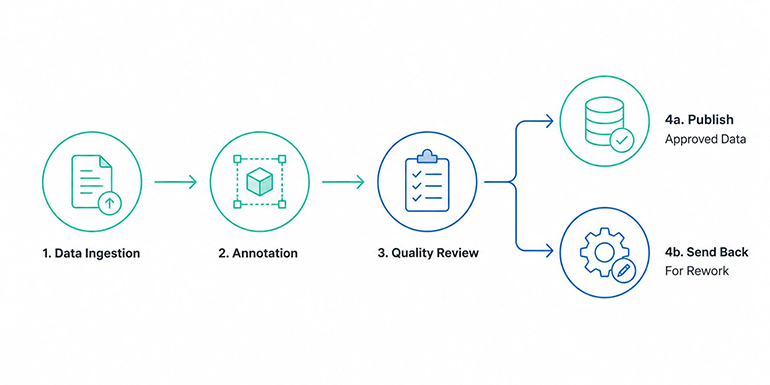
Another: annotate boxes first and ship a working detector in weeks rather than months, then add polygon labels on the subset the deployed model gets wrong. Production failures are a better sampling strategy than anything you can design up front.
A third, for teams with a fixed budget: use box supervision to generate candidate masks, then have humans correct only the ones the model flags as low confidence. Correction is materially faster than drawing, which is the same human-in-the-loop pattern behind SA-1B.
The one thing all three need is a labeling guideline that defines both formats consistently from day one. Retrofitting a polygon spec onto a box project produces two datasets that disagree with each other, and reconciling them costs more than doing it properly at the start.
Common Mistakes in Object Detection Labeling Projects
Four failure patterns account for most of the rework I see.
Buying polygons for a detection model. The single most expensive mistake, and the easiest to avoid. Ask which model, and which loss.
Boxing thin objects. Lane detection projects that box lane markings. Infrastructure projects that box cables. The labels are technically correct and the model cannot learn from them. Polylines are usually the right answer here rather than either boxes or polygons.
No vertex density rule. “Trace the object” means 8 vertices to one annotator and 60 to another. That is a 7x cost variance and an inconsistent dataset. Specify a maximum deviation from the true boundary in pixels, not a vertex count, and let object complexity determine the rest.
Measuring polygon quality with box IoU. Mask IoU is dominated by the interior, which is easy. A mask can score 0.95 IoU while the boundary is visibly wrong, and the boundary is the entire reason you bought polygons. Track boundary IoU alongside mask IoU, or you are paying for precision you never verify. Our guide to image annotation quality metrics covers how these differ in practice.
A fifth, less common but worse: assuming polygon labels are automatically better than box labels. They are only better if the QA catches the boundary errors, and boundary errors are much harder to spot in review than a badly placed box.
Bounding Box vs Polygon Annotation Cost: A Worked Example
Using the offshore blended ranges from our image annotation pricing benchmarks, a 100,000-image dataset averaging 8 objects per image works out roughly like this:
| Approach | Unit rate | Approximate total |
|---|---|---|
| Bounding boxes | $0.03 to $0.12 per box | $24,000 to $96,000 |
| Polygons | $0.10 to $0.80 per polygon | $80,000 to $640,000 |
| Boxes on all, polygons on 15% | Blended | $36,000 to $190,000 |
The spread inside each row is wider than the gap between rows, which tells you something. Object density, occlusion, boundary tolerance, and QA depth move the number more than the annotation type does. A vendor quoting you a single per-polygon rate without seeing your data is quoting a fiction.
Add to the polygon line whatever your QA rework rate is. Ambiguous guidelines routinely add 15 to 30% on top of the original cost, and polygons are more sensitive to ambiguity than boxes because there are more ways to draw them wrong.
Image Labeling Tools for Bounding Box and Polygon Annotation
The tooling landscape matters mostly for whether you get model-assisted polygon drawing.
CVAT is open source, integrates SAM for interactive segmentation, and exports COCO, Pascal VOC and YOLO. Zero licensing, real setup cost.
Labelbox offers Model-Assisted Labeling, where your own model’s predictions seed the annotation queue. Strong for enterprise QA workflows.
Roboflow suits teams training YOLO-family models, with annotation, augmentation and training in one loop.
SuperAnnotate and V7 Darwin both handle assisted segmentation well, with V7 the usual pick for DICOM and medical work. If you are still shortlisting, this comparison of 15 image annotation tools covers pricing and deployment across the rest.
For reference formats and evaluation conventions, the COCO dataset remains the standard both formats are measured against.
We work inside whichever of these you already use rather than moving your data into ours. The platform matters less than whether the pre-labeling model is actually helping on your specific data, which you can only find out by measuring acceptance rate on a pilot batch.
How HabileData Handles Bounding Box and Polygon Projects
Most of what I have described above is the conversation we have when scoping an image annotation project, before anyone quotes a number.
We measure the two against different thresholds, because they are different problems. Bounding box annotation is held to 95%+ IoU, polygon to 93%+, semantic segmentation to 92%+. Every batch carries per-class IoU scores, and anything under the agreed threshold gets re-annotated at our cost. That is the only version of a quality guarantee that means anything.
The QA runs in three stages: a stratified 15 to 20% peer review sample, a specialist pass on everything flagged, then inter-annotator agreement calculated on the batch. Polygon annotation needs this more than box work does, because boundary errors survive casual review.
Where pre-labeling helps, we use it. Where it does not, we say so rather than quietly charging you for corrections that took longer than drawing. Output goes back in whatever format your pipeline expects, which for most teams means COCO JSON, YOLO TXT or PNG masks.
If you are choosing between formats right now, the useful next step is a pilot: a few thousand images labeled both ways, scored against your actual model. That is a smaller decision than a 400,000-image commitment, and it answers the question with your data instead of someone else’s benchmark.
Bounding Box vs Polygon Annotation: The Short Version
Boxes are the correct annotation for detection work, and on compact axis-aligned objects they give up almost nothing. Polygons are the required input for measurement, boundary and occlusion-heavy tasks. Treating one as a budget version of the other is what produces the expensive mistakes.
Before you commit, check what your loss function consumes, what your objects look like geometrically, and whether box supervision gets you close enough. The first two take an afternoon. The third takes a pilot.
Bounding Box vs Polygon Annotation FAQs
Polygon, on any object that is not a compact axis-aligned rectangle. The gap is measurable: a perfect box around a 3:1 object rotated 30 degrees achieves at most 41% IoU against the object’s true extent, while a polygon can approach 100%. On upright pedestrians or products shot square, the difference is small.
When you need to measure area or boundary, when objects overlap and must be separated at the pixel level, when objects are thin or diagonal, or when your model is a segmentation architecture. Medical imaging, satellite land use, defect sizing and fashion attribute extraction all qualify.
Only if the model consumes masks or the task needs boundaries. If you are running detection, polygons buy nothing. Test whether box-supervised segmentation gets you close enough first, since published methods now reach 33 to 38 mask AP on COCO without any mask labels.
Yes, as training supervision. Methods like BoxInst and Box2Mask learn masks from box annotations, and Box2Mask has outscored fully mask-supervised Mask R-CNN on COCO. This works best on natural images. On low-contrast medical or specialized industrial data, the gap widens considerably.
Roughly 4 to 8 times per object at 2026 offshore rates, against a manual drawing ratio of about 10 to 1. Model-assisted tooling closes most of that gap on data the foundation models handle well, and closes none of it on data they do not.
Do not specify a count. Specify a maximum deviation from the true boundary in pixels and let object complexity decide. COCO polygons average about 24.5 vertices per instance for context, rising to 33.4 on large objects.
Yes, and most well-scoped projects do. Box everything, polygon the subset that needs it. This requires a single labeling guideline defining both formats from the start, or the two halves of your dataset will disagree.
Let us label a sample both ways so you can decide on evidence.
Talk to us about a pilot batch »

Biju Peter is a Senior Project Manager with 22+ years in the BPM industry, specializing in large-scale data operations and annotation-driven projects. He brings deep expertise in data processing, web research, scraping, and multi-modal annotation across image, text, audio, and video domains. He has successfully led 200+ projects, managed large teams, and delivered scalable, high-quality solutions for global AI and machine learning initiatives for clients across the globe. 🔗Connect with Biju on LinkedIn