
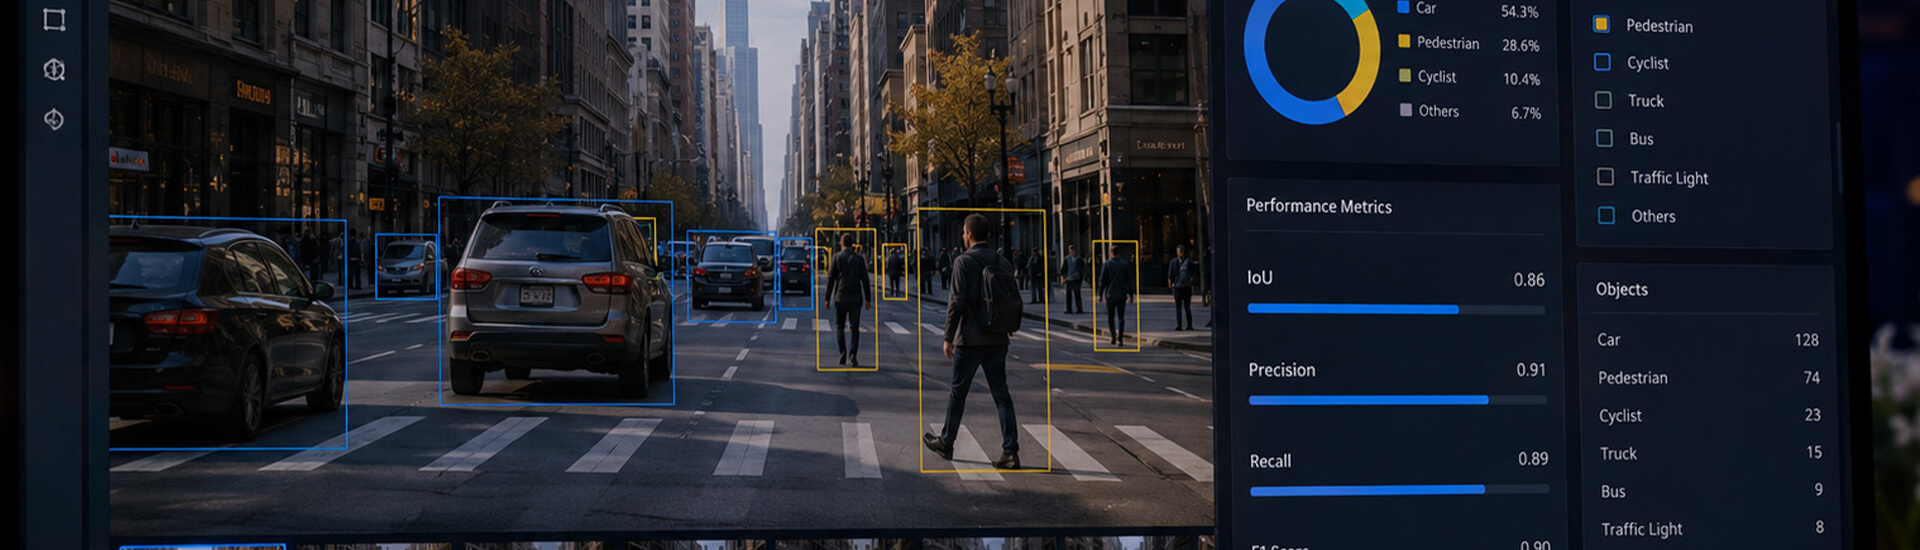
Image annotation quality is measured with IoU (box overlap), precision (correctness), recall (completeness), and F1 (balance). This guide gives simple formulas, COCO-based thresholds, real vehicle and medical examples, common label failures, and a repeatable QA workflow that stops bad labels before training.
Contents
- Quick Answer: Which Metrics Measure Image Annotation Quality?
- What Does “Annotation Quality” Actually Mean?
- Intersection over Union (IoU): Is the Box in the Right Place?
- Precision: Are Your Labels Actually Correct?
- Recall: Did You Catch Everything That Was There?
- F1 Score: One Honest Number When You Need It
- IoU vs Precision vs Recall vs F1: A Side-by-Side Comparison
- The Annotation Quality Problems These Metrics Catch
- How to Improve Image Annotation Quality
- A Real-World Annotation Validation Workflow
- Why Annotation Quality Drives ROI, Not Just Accuracy
- The Bottom Line
- Frequently Asked Questions
Most “model problems” I get called in to debug turn out to be label problems wearing a model costume.
A detector keeps missing pedestrians at night. Everyone wants to retrain the backbone. Then you open the training set and half the night-time pedestrians were never boxed.
The model learned exactly what you taught it: after dark, there are no people. That is annotation quality failing in the quietest way possible.
The trouble is that bad labels stay invisible until they are baked into your weights, and by then they are expensive. So before you touch a hyperparameter, you measure the labels.
This guide walks through the four metrics that tell you whether your labels are any good, with formulas, thresholds, and examples from real datasets.
Quick Answer: Which Metrics Measure Image Annotation Quality?
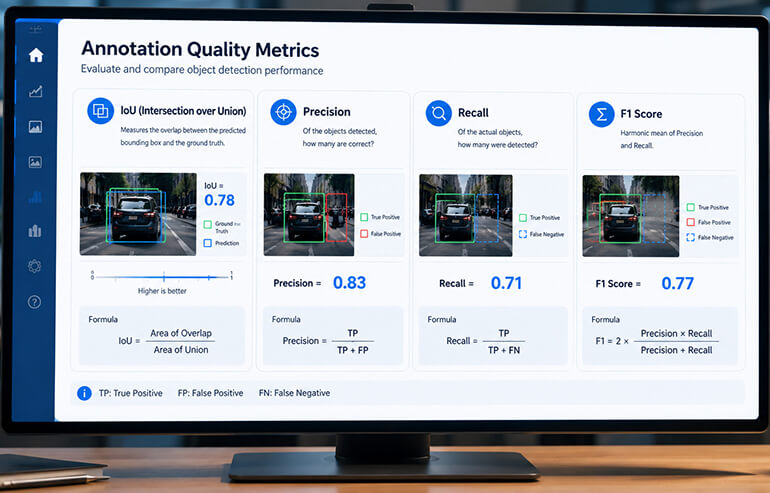
Four metrics carry most of the load. IoU measures how well an annotated box overlaps the true object. Precision measures how many labels are correct. Recall measures how many objects you caught. F1 folds precision and recall into one score.
What Does “Annotation Quality” Actually Mean?

Ask ten people and most say “the labels look right.” That answer is the trap.
A box can look fine to your eye and still be wrong for a model. It might sit 15 pixels loose on every side. It might have the right class but clip the object.
Or the labels might be beautifully drawn and simply missing for a whole category of hard cases. To your eye, nothing looks wrong. To the model, a pattern is missing.
Real quality is three things at once. Are the boxes tight and correctly placed? Are the labels the right class? And did you catch everything you were supposed to?
IoU checks the geometry, precision checks correctness, recall checks coverage. You need all three, because your model will happily exploit whichever one you ignore.
Put simply: annotation quality sets the ceiling on your model’s accuracy. Getting it right the first time is what saves you from expensive relabeling later.
Intersection over Union (IoU): Is the Box in the Right Place?
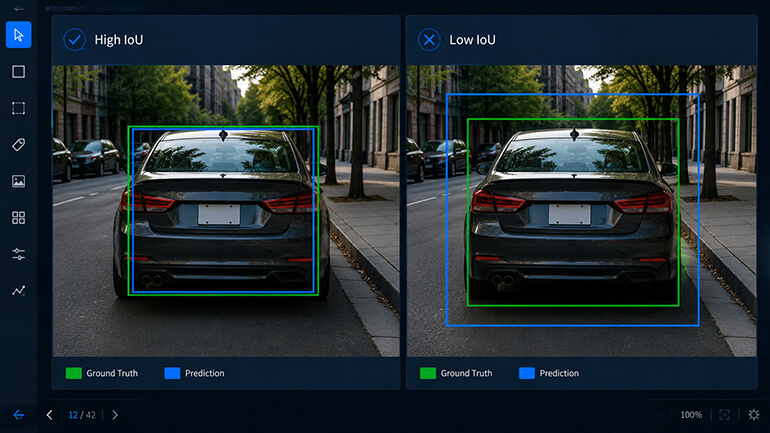
IoU measures overlap. Take the annotated box and the ground-truth box, look at how much area they share, then divide by how much area they cover together.
IoU = Area of Overlap / Area of Union
Two boxes sitting exactly on top of each other score 1.0. Two boxes that never touch score 0. Everything real lives in between.
A box that is roughly right but loose might land around 0.6. A tight, well-placed box gets you into the 0.85-plus range.
Your threshold is the line above which a box counts as correct. It is not an arbitrary pick. It should match how much error your use case can absorb.
The COCO benchmark is the standard reporting format for detection research. It evaluates across IoU thresholds from 0.5 to 0.95 in steps of 0.05.
It reports the loose 0.5 point and the stricter 0.75 point separately, as AP50 and AP75. Per the COCO detection evaluation guidelines, the headline score averages over that full range.
Why average over the higher thresholds? Because it rewards detectors with better localization, not just rough hits. Stricter overlap forces tighter boxes.
Here is how those thresholds translate to real decisions:
| IoU threshold | What it means in practice |
|---|---|
| 0.5 | Loose. Fine for early prototypes and easy, well-separated objects. |
| 0.75 | The workhorse for most production detection projects. |
| 0.9-plus | Strict. Medical imaging, precise measurement, small critical objects. |
Where it bites: say you are annotating cars for an autonomous driving set. Two annotators box the same car. One draws tight to the paint, the other leaves a margin.
Both look reasonable in the tool. Their IoU against each other might be only 0.7. Now you have two “correct” boxes that disagree.
Train on the loose ones and the model learns loose boxes. That is the last thing you want when a car is deciding how much room it has.
This is why teams set a re-annotation trigger on IoU. A box that clips an object by 20% teaches the wrong boundary across every training iteration, so low-overlap batches go back before they reach the model.
Precision: Are Your Labels Actually Correct?
Precision answers one question. Of everything you labeled, how much was right?
Precision = True Positives / (True Positives + False Positives)
A false positive is a box that should not exist. A shadow labeled as a car. A reflection labeled as a person. Two boxes on one object.
High precision means your annotators are not inventing things. It is the metric you care about when a wrong label is expensive.
In a retail shelf-scanning system, a phantom product throws off inventory counts and people stop trusting the numbers. The error spreads past the one bad box.
In medical imaging, a false positive can send a patient to a follow-up they never needed. When the cost of crying wolf is high, you optimize for precision.
Recall: Did You Catch Everything That Was There?
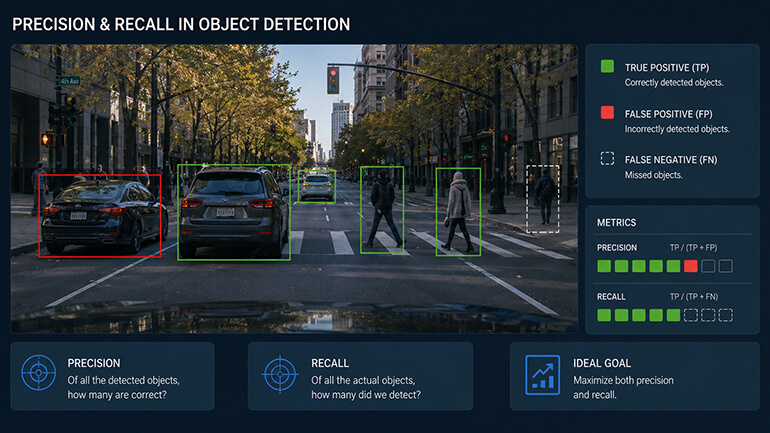
Recall flips the question. Of everything that was actually present, how much did you catch?
Recall = True Positives / (True Positives + False Negatives)
A false negative is the object you missed. The pedestrian in the shadow. The tumor nobody marked. The small sign in the distance.
These are the dangerous ones. A missing label teaches the model that the thing simply does not exist in that context.
Recall rules when misses are what hurt you. Go back to the night-time pedestrian problem from the intro. That was a recall failure, start to finish.
The boxes that existed were fine. The problem was all the ones that were not there. For safety-critical detection, low recall in your labels is a slow accident waiting in the data.
F1 Score: One Honest Number When You Need It
Precision and recall pull against each other. Tell annotators to label only what they are sure about, and precision climbs while recall drops.
Tell them to catch everything, and recall climbs while precision falls. F1 is the referee that keeps both honest.
F1 = 2 x (Precision x Recall) / (Precision + Recall)
F1 is the harmonic mean, which is a formal way of saying it punishes imbalance. You cannot game it by acing one metric and tanking the other.
A dataset at 95% precision and 40% recall does not average out to a comfortable 67%. It lands near 56%, because the harmonic mean drags you toward your weakest number.
Reach for F1 when you cannot afford to be lopsided, which is most of the time. Raw accuracy will lie to you on imbalanced data.
If 98% of the frame is background, an annotator who labels nothing still scores 98% accurate and catches zero objects. F1 does not let that slide.
IoU vs Precision vs Recall vs F1: A Side-by-Side Comparison
| Metric | What it measures | Strength | Limitation | Best use case |
|---|---|---|---|---|
| IoU | Box overlap with ground truth | Directly scores box geometry | Silent on class errors and missed objects | Bounding box tightness, localization checks |
| Precision | Share of labels that are correct | Catches false positives and over-labeling | Blind to missed objects | Retail counts, medical false-alarm control |
| Recall | Share of real objects caught | Catches missed objects | Blind to junk labels | Safety detection, rare object coverage |
| F1 | Balance of precision and recall | One honest number, resists gaming | Hides which side is weak | Comparing datasets or annotator batches |
The Annotation Quality Problems These Metrics Catch
Every messy dataset I have reviewed fails in a handful of predictable ways.
Loose or drifting boxes show up as low IoU. Consistent margins around objects teach the model sloppy localization, one box at a time.
Missed objects show up as low recall. The occluded, small, or low-contrast things nobody boxed are the most dangerous, because the failure is silent.
Class inconsistency is sneakier. When “truck” and “lorry” get used interchangeably, per-box precision still looks fine while your class boundaries turn to mush.
Duplicate and overlapping boxes are the last common one. Two annotators on one object inflate false positives and quietly tank precision.
The pattern never changes. The errors that hurt most are the ones your eye skims right past. That is exactly why you measure instead of eyeballing.
How to Improve Image Annotation Quality
You do not fix quality by measuring harder. You fix it upstream and then verify with the metrics.
Start with real guidelines, not a paragraph. If SUVs count as cars, write it down with a picture. If boxes must be tight to the visible edge, show what tight looks like.
Show what too loose looks like too. Most class inconsistency traces straight back to a rulebook that left room for interpretation.
Then build QA in layers. A first-pass annotator, a reviewer who checks against the guidelines, and blind spot-audits where a senior person re-labels a random sample.
Against that sample you compute IoU, precision, and recall. One layer catches typos. Layers catch systematic drift you would never spot by hand.
A common setup is a three-stage review with inter-annotator agreement measured on every batch. That way quality is a number you can see before training, not a hope.
Keep humans in the loop even when tools help. Model-assisted pre-labeling and automatic IoU flags save real time, but a flag is a suggestion, not a verdict.
The human-in-the-loop approach matters here. The loop between automation and human judgment is what keeps accuracy improving instead of plateauing on the model’s own blind spots.
And invest in the annotators themselves. A calibrated team that has seen your edge cases beats a bigger team that has not, every time. Quality is mostly a training problem dressed as a tooling problem.
A Real-World Annotation Validation Workflow
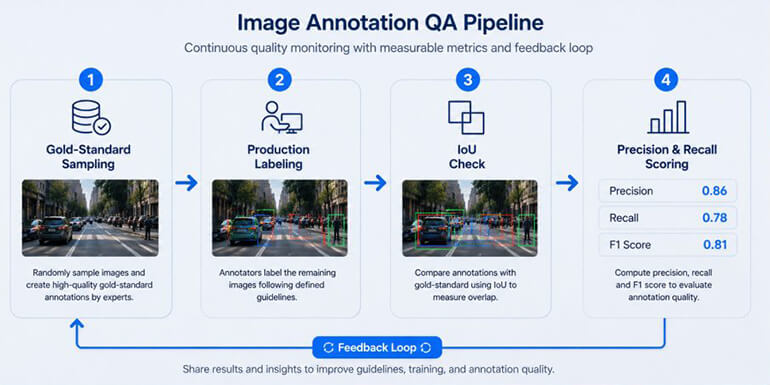
Here is a realistic validation pass on a 50,000-image vehicle detection set. The shape of it works for almost any detection dataset.
First, carve out a gold-standard sample. Take 1,000 images, have your most trusted annotator label them carefully, then have a second senior person review.
That reviewed set becomes your ground truth. A useful bar to borrow: make annotators clear an accuracy threshold on this set before they touch production data.
Next, run the production labels against the gold set. For every matched box, compute IoU. Anything under your 0.75 threshold gets flagged.
You will usually find a cluster of annotators who draw loose. Now you know exactly who needs feedback, instead of guessing.
Then compute precision and recall. Count the boxes the team added that are not in the gold set. Those false positives are a precision problem.
Count the gold boxes they missed. Those false negatives are a recall problem. Roll both into F1 for one trackable number per annotator batch.
The point is not to grade the team. It is to find where the labels break, then close the gap.
You might learn that IoU is solid but recall dips on occluded vehicles. So you write a guideline note and re-audit. Next batch, recall climbs.
Measure, target, fix, re-measure. That loop is most of the job, and it is what separates a dataset you trust from one you hope about.
Why Annotation Quality Drives ROI, Not Just Accuracy
Bad labels do not announce themselves on the budget line. They show up later, disguised as a model that will not hit target no matter how long it trains.
The math is simple. A model cannot exceed the ceiling its labels set. Feed it 80% recall and you cap what it can learn about the objects it never saw marked.
Teams routinely burn weeks on architecture and tuning, chasing points that were lost during annotation months earlier. The debugging costs far more than the fix would have.
Catching it before training costs a fraction of that, and these four metrics are how you catch it. A model that fails in production almost always traces back to training data quality.
That is the real argument for measuring labels early. Annotation errors compound fast across millions of examples, so a small label problem becomes a large model problem.
The Bottom Line
Measure your labels before you blame your model. IoU for box geometry, precision for correctness, recall for coverage, and F1 when you need one honest number.
Get those right and most of your “model problems” quietly disappear. The metrics are cheap. The retraining you avoid is not.
The workflow above is vendor-neutral. You can run it in-house with a gold-standard set and a spreadsheet, or hand it to a partner when the dataset outgrows manual review.
For reference, this is the kind of work we do at HabileData: image annotation and broader data annotation built on a measured, multi-stage QA process.
Frequently Asked Questions
It depends on the job. 0.5 is a loose floor, 0.75 is a solid production target, and 0.9-plus suits medical imaging. Match the threshold to the cost of being a little off.
Accuracy collapses on imbalanced images. When most of the frame is background, you can score 98% accurate by labeling nothing at all. F1 combines precision and recall, so it cannot be fooled by ignoring the objects that actually matter.
Build a small gold-standard set labeled by your best people, then compare production labels against it. Low IoU means loose boxes, false positives hurt precision, and false negatives hurt recall. That tells you which error type you have.
Most serious annotation platforms compute IoU and flag low-overlap boxes automatically, and pre-labeling speeds up review. Treat these as suggestions. The final quality call still needs a human comparing against a trusted reference.
Ask what a mistake costs. If false alarms are expensive, as in retail counts, lean toward precision. If misses are dangerous, as with pedestrians or tumors, lean toward recall. When both matter equally, use F1.
Often, yes. A model cannot beat the ceiling its labels set. If recall in the training data is low, the model never learns objects it never saw marked. Rule out labels before you rebuild the architecture.
Big enough to be representative, not so big it becomes its own project. For a large set, 1,000 to 2,000 carefully reviewed images usually surfaces the systematic problems. Coverage of your hard cases matters more than raw count.
Need labels measured, not hoped about? Let’s discuss your dataset.
Talk to an Expert »


Biju Peter is a Senior Project Manager with 22+ years in the BPM industry, specializing in large-scale data operations and annotation-driven projects. He brings deep expertise in data processing, web research, scraping, and multi-modal annotation across image, text, audio, and video domains. He has successfully led 200+ projects, managed large teams, and delivered scalable, high-quality solutions for global AI and machine learning initiatives for clients across the globe. 🔗Connect with Biju on LinkedIn