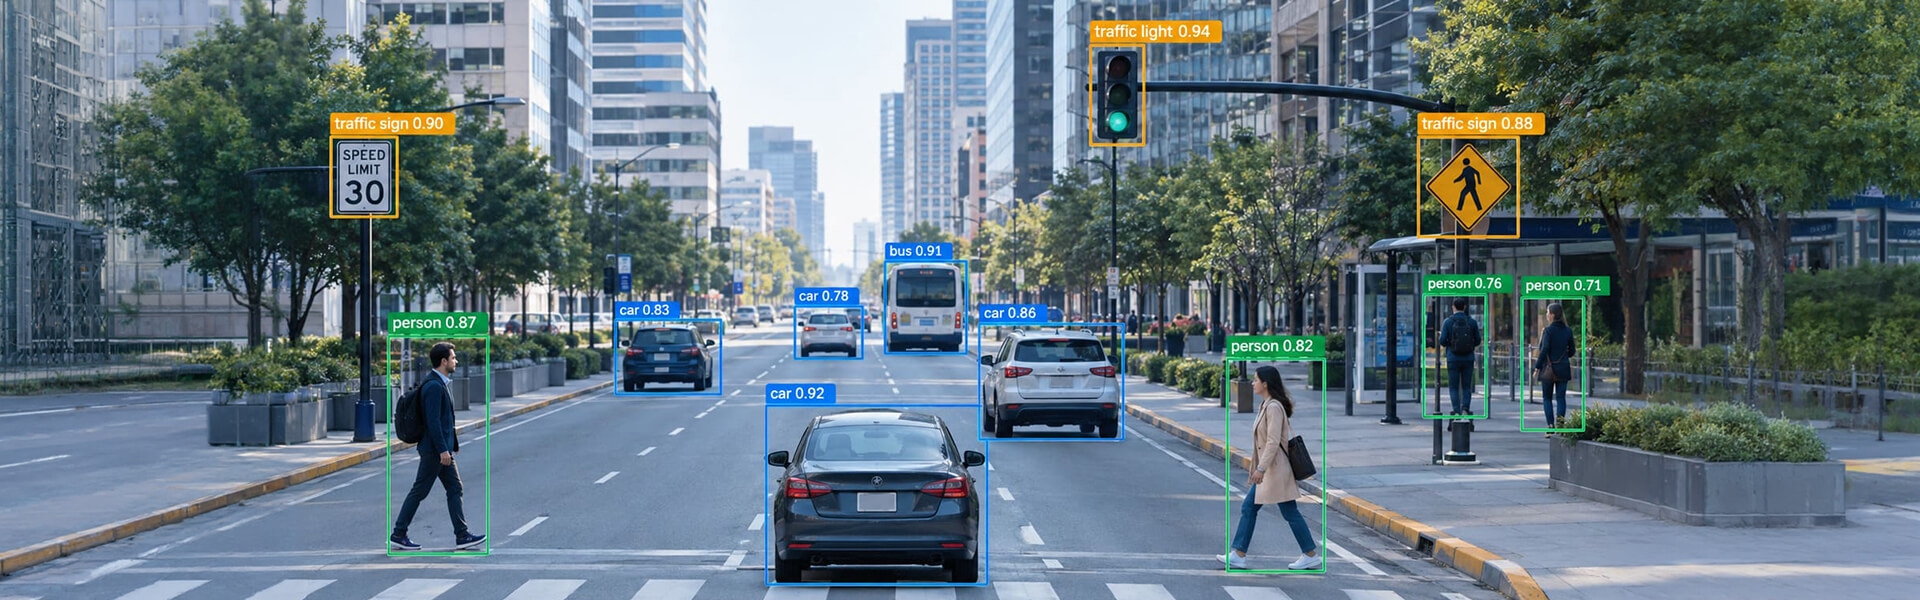
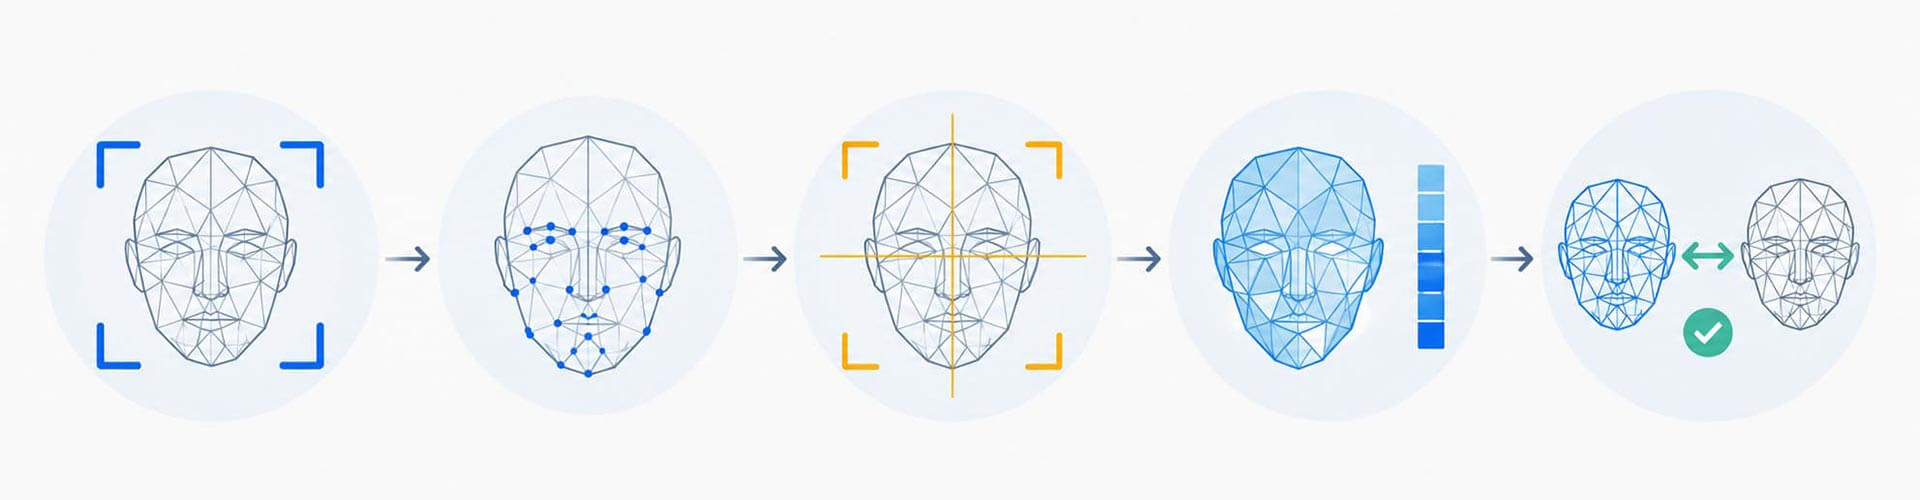
A stage-by-stage technical explanation of facial recognition: detection, landmark localization and alignment, embedding generation, and matching. Covers score thresholds, FMR and FNMR, why 1:N is harder than 1:1, and the annotation each stage requires.
Contents
- Key Takeaways
- How Facial Recognition Works: The Short Answer
- Detection, Recognition, and Analysis Are Different Things
- Stage 1: Face Detection
- Stage 2: Landmark Localization
- Stage 3: Alignment
- Stage 4: Embedding Generation
- Stage 5: Matching
- Why the Same System Gives Different Accuracy in Different Places
- Where Face Pipelines Fail, Stage by Stage
- The Training Data Behind Each Stage
- What Face Annotation Projects Get Wrong
- Legal Constraints on Face Datasets
- Questions to Ask a Vendor
- Where This Leaves You
- Frequently Asked Questions
Most explanations of facial recognition describe a system that measures the gap between your eyes and the width of your nose. That description was accurate twenty-five years ago. It is not how any current system works.
What actually happens is narrower and stranger. The software finds a face, uses a handful of anchor points to straighten it, and converts the straightened crop into a list of numbers. Identity is decided by comparing two lists of numbers.
That difference matters if you are specifying, buying, or building one of these systems. It changes what “accuracy” means, why a pilot that worked collapses at production scale, and what training data you need before any of it runs.
This article walks through the five stages in order. It also covers the part vendor documentation leaves out: the four separate labeled datasets that sit behind those five stages.
Key Takeaways
- Facial recognition runs in five stages: detect the face, locate landmarks, align the crop, generate an embedding, compare embeddings against stored templates.
- Landmarks standardize the face crop geometrically. They are not what the system compares to establish identity.
- Identity comparison happens on a fixed-length vector, typically 128 or 512 numbers, produced by a neural network. The similarity score is a distance between two of those vectors.
- A threshold turns a score into a decision. The right threshold depends on gallery size and on which error the deployment can tolerate.
- One-to-many search is not one-to-one at scale. False positive rates rise roughly in proportion to the number of enrolled identities.
- Each stage is trained on a different annotation type. A team that budgets only for face boxes will be short three datasets.
How Facial Recognition Works: The Short Answer
Facial recognition works by converting a face into a numerical vector and comparing that vector against stored vectors.
A detector locates the face and returns a bounding box. A landmark model finds anchor points such as the eye centers and mouth corners. Those points are used to rotate, scale, and crop the face into a standard position.
A neural network then converts the standardized crop into a fixed-length vector called an embedding, or template. The system compares that embedding against one stored template (verification) or against many (identification).
The comparison returns a similarity score. A threshold turns that score into a match or no-match decision.
In most well-designed systems the photograph is discarded after enrollment. What is stored and compared is the vector.
Older accounts of this technology describe the system as measuring named distances on the face. That was accurate for the geometric methods of the 1990s and early 2000s.
A modern embedding network learns which visual features separate identities. Those learned features do not map cleanly onto anatomical measurements a person could name.
Detection, Recognition, and Analysis Are Different Things
These three get used interchangeably in procurement documents, and the confusion causes real problems in scoping.
| Capability | Question it answers | Output | Personal data? |
|---|---|---|---|
| Face detection | Is there a face here, and where? | Bounding box, confidence score, sometimes landmarks | Generally no, if nothing is stored |
| Face analysis | What are the attributes of this face? | Estimated age range, expression, head pose, glasses, mask | Sometimes, depending on jurisdiction and attribute |
| Face verification (1:1) | Is this the person they claim to be? | Similarity score against one stored template | Yes, bio-metric data |
| Face identification (1:N) | Who is this, among the people we have enrolled? | Ranked candidate list with scores | Yes, bio-metric data, and usually higher risk |
A camera that boxes faces to trigger autofocus is doing detection. It is not doing recognition, and it stores no templates.
Conflating the two inflates compliance scope on one side and hides real exposure on the other.
Stage 1: Face Detection
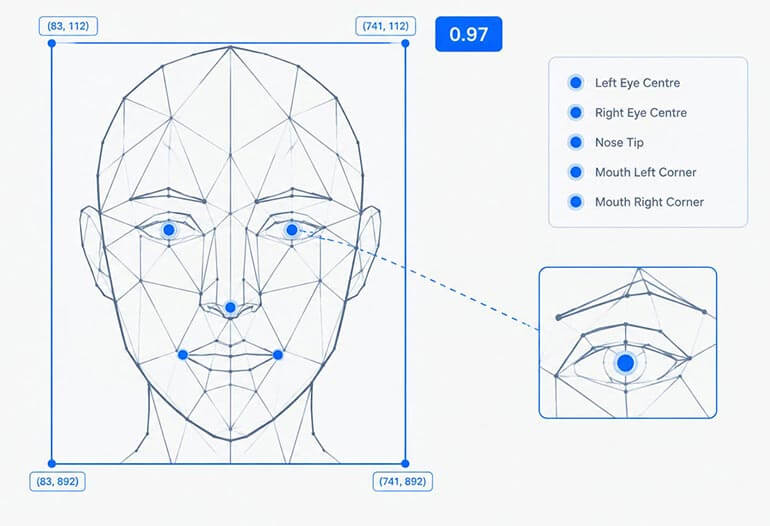
Detection answers one question: where in this frame is there a face?
A detector scans the image and returns, for each face it finds, a bounding box in pixel coordinates and a confidence score. Current detectors also return a small set of landmark points in the same forward pass.
RetinaFace and SCRFD are common choices. Older pipelines used MTCNN, which cascaded three small networks, or Haar cascades before that.
What matters operationally is not which detector you pick but what you do with the confidence score and the box.
Detection confidence is a tuning parameter, not a fixed property. Lower it and you pick up faces at extreme angles and small pixel sizes, along with a lot of non-faces: wallpaper patterns, faces on posters, reflections.
Raise it and you lose the difficult faces that are often exactly the ones you needed to find. The usual practice in access control and identity verification is to detect permissively, then filter on a separate quality check.
Box size sets the ceiling on everything downstream. A face occupying 30 pixels of inter-eye distance will not produce a useful template, regardless of how good the embedding model is.
Many production systems enforce a minimum inter-ocular pixel distance at capture. Rejecting the image is better than generating a weak template that quietly poisons the gallery.
Multiple faces in one frame is a common and underestimated case. NIST reports that roughly three percent of its border images contain more than one face, rising to about seven percent for kiosk images.
If your system assumes one face per frame, it will silently pick the wrong one in those cases.
Stage 2: Landmark Localization
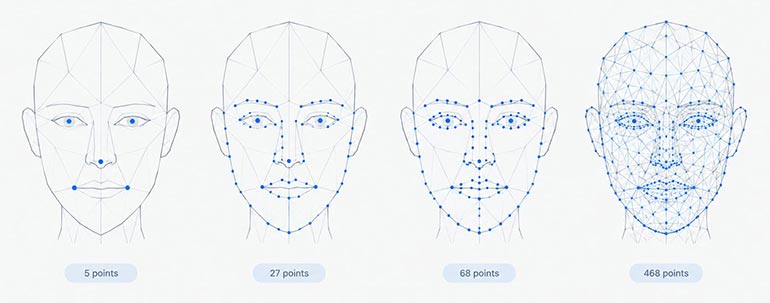
A landmark model takes the cropped face region and predicts the coordinates of a defined set of points on it.
Definition: facial landmarks are predefined anatomical reference points on a face, expressed as x and y pixel coordinates, used to describe facial geometry. Common schemes range from five points to several hundred.
The count depends on what the points are for. This is where most explanations go wrong, by implying that more points means better recognition.
| Scheme | Points | Origin / common use | Used for identity matching? |
|---|---|---|---|
| Sparse | 5 | Eye centers, nose tip, mouth corners; returned by RetinaFace and similar detectors | Yes, for alignment |
| 300-W | 68 | Standard research benchmark: jawline, brows, eyes, nose, lips | Rarely; used for shape and expression |
| WFLW | 98 | Denser benchmark with heavy occlusion and pose variation | No |
| MediaPipe Face Mesh | 468 (478 with iris) | Dense mesh for AR, avatars, gaze and blink tracking | No |
Recognition pipelines typically consume five points. ArcFace, the model family that became the production default for face embeddings, aligns its training and inference crops using five facial points predicted by a detector.
The denser schemes exist for different tasks. Driver monitoring reads eyelid and head-pose geometry. AR filters need a mesh to deform. Orthodontic and surgical planning tools measure facial ratios.
So when someone asks how many landmarks facial recognition uses, the honest answer is five. Adjacent features in the same product may use far more for reasons unrelated to identity.
The practical failure mode here is not missing points but systematically displaced ones. A model that places the eye centre two pixels low across an entire lighting condition will not throw an error.
It will produce slightly rotated, slightly mis-scaled crops, and scores will drop for everyone in that condition.
Errors of this kind trace back to the training data far more often than to the architecture. That is why landmark annotation is treated as a precision task rather than a volume task.
Stage 3: Alignment
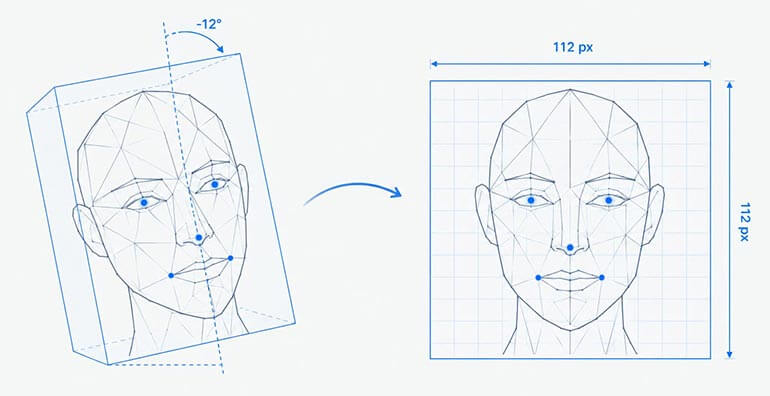
Alignment is the step that actually uses the landmarks, and the step most articles skip.
The detected landmark coordinates are compared against a fixed template of target coordinates. A similarity transform is computed from that correspondence, giving a rotation, a uniform scale, and a translation.
Applying the transform produces a crop in which the eyes sit at the same pixel positions in every image the system will ever process. ArcFace and its descendants use a 112 by 112 pixel crop.
The reason this matters is straightforward. The embedding network learns to map appearance to identity.
If the input also varies in rotation and scale, the network has to spend capacity learning to ignore that variation, and it does so imperfectly. Removing the variation geometrically first is cheaper and more reliable.
This is also why alignment errors are expensive. A crop rotated three degrees off the canonical position is, to the network, a slightly different face. Skipping alignment entirely degrades similarity scores measurably.
Roll, meaning in-plane rotation, is fully correctable by the similarity transform. Yaw and pitch are not.
A face turned 40 degrees away from the camera cannot be transformed into a frontal view by rotation and scaling. The pixels are not there.
Systems handle that case by rejecting the capture, by enrolling multiple poses per identity, or by using a pose-robust model that trades some frontal accuracy for angular tolerance.
Stage 4: Embedding Generation
The aligned crop goes into a convolutional or transformer backbone, and a vector comes out.
Definition: a face embedding, also called a template or face-print, is a fixed-length vector of floating-point numbers that encodes a face’s identity-relevant features. It is compared to other embeddings by distance rather than by visual inspection.
FaceNet, the 2015 model that popularized the approach, produced 128 dimensions. It trained with a triplet loss that pulled same-identity pairs together and pushed different-identity pairs apart.
ArcFace, published in 2018 and still the common production baseline, produces 512 dimensions. It trains with an additive angular margin loss, placing embeddings and class centers on a unit hypersphere and imposing a fixed angular margin between identities.
The effect is tighter clusters per identity and wider gaps between identities than plain softmax training produces.
The output is L2-normalized to unit length. That is what allows cosine similarity and Euclidean distance to be used interchangeably as a matching metric.
Three practical consequences follow from the embedding being a vector of known size.
Storage is predictable. A 512-dimensional float32 template is two kilobytes, so ten million identities at one template each come to roughly 20 GB.
That fits in memory on a single large server, which is why 1:N search at scale is feasible at all.
Latency splits cleanly. Template generation is the expensive part and runs once per probe image, while comparison is a dot product. If your system is slow, the bottleneck is detection and embedding, not matching.
Templates are not photographs, but they are not anonymous either. A template cannot be casually rendered back into a recognizable face.
Research on template inversion has shown that approximate reconstructions are possible, and every major privacy regime treats bio-metric templates as personal data. Storing templates instead of images reduces exposure without removing it.
Stage 5: Matching
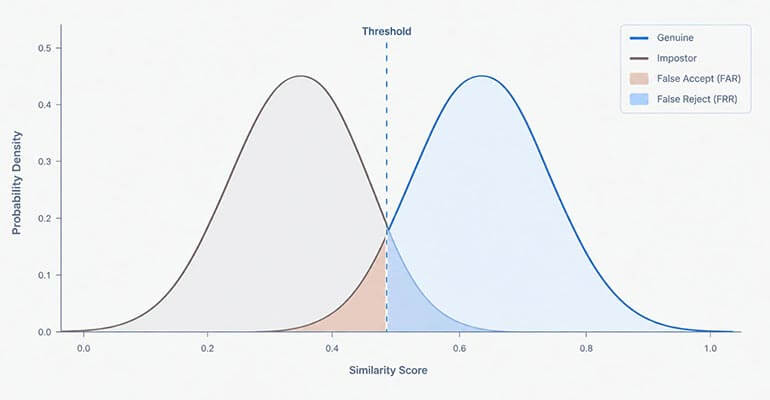
Matching compares the probe template against stored templates and produces a similarity score. A threshold converts that score into a decision.
There are two modes, and they have different mathematics.
Verification (1:1) compares the probe against one claimed identity. A phone unlock, a passport gate checking against the chip photo, a login step-up check. One comparison, one decision.
Identification (1:N) compares the probe against every template in a gallery and returns the highest-scoring candidates. A duplicate-enrollment check, a watchlist search, a de-duplication pass. N comparisons, and each one can produce a false positive.
The four error rates that matter
Accuracy as a single percentage is not a usable number. The four rates below are what benchmarks and procurement documents actually specify.
| Rate | Mode | What it measures |
|---|---|---|
| Sparse | 5 | Eye centers, nose tip, mouth corners; returned by RetinaFace and similar detectors |
| FMR (false match rate) | 1:1 | Proportion of comparisons between different people that score above the threshold |
| FNMR (false non-match rate) | 1:1 | Proportion of comparisons between images of the same person that score below the threshold |
| FPIR (false positive identification rate) | 1:N | Proportion of searches for a non-enrolled person that return a candidate |
| FNIR (false negative identification rate) | 1:N | Proportion of searches for an enrolled person that fail to return them |
FMR and FNMR trade against each other along a single dial. Raise the threshold and false matches fall while false non-matches rise. No setting reduces both.
This is why an accuracy figure quoted without an operating point should be treated as marketing.
NIST’s Face Recognition Technology Evaluation reports FNMR at fixed FMR values, which is the correct way to state it. The evaluation has run since 2017 and, as of its September 2026 update, had tested 1,462 algorithm submissions from 447 developers.
The spread between the best and worst submitted algorithms is wide. “We use AI facial recognition” tells you nothing about a system’s performance.
Why 1:N is not 1:1 repeated
A search against a gallery of N identities produces N comparison scores, and a false positive occurs if any one of them crosses the threshold.
At high thresholds, the false positive identification rate is approximately the gallery size multiplied by the false match rate.
The practical effect is severe. A false match rate of one in a million is a reasonable operating point for a 1:1 check.
Run the same threshold against a ten-million-person gallery and the arithmetic gives roughly ten false candidates per search, on average, before you find the right person at all.
This is the most common scoping error in face identification projects. A pilot is tuned against a gallery of a few thousand people and accuracy looks excellent.
The system is then pointed at the production gallery and the candidate lists fill with strangers. Nothing in the model changed. The arithmetic did.
Two implications follow. Thresholds for 1:N must be set against the production gallery size, not the pilot’s.
1:N systems should almost always return a ranked candidate list for human adjudication rather than an automatic identification, because the top candidate being wrong is routine rather than exceptional.
Setting a threshold
The procedure is empirical, and it has to run on your own imagery.
- Assemble a labeled evaluation set from the same cameras, lighting, and population as the deployment. Vendor benchmark data will not transfer.
- Generate every genuine pair (same person) and a large sample of impostor pairs (different people).
- Score all pairs and plot the two score distributions. They overlap. The overlap is the error.
- Decide which error costs more. A border gate that falsely rejects a traveler creates a queue. A payment authorization that falsely accepts creates a fraud loss.
- Pick the threshold that gives the tolerable rate on the expensive error, and accept the resulting rate on the other.
- Re-measure after any camera change, any enrollment policy change, and any gallery growth.
Step six gets skipped. It is also the one that causes systems to degrade quietly over their first eighteen months of operation.
Why the Same System Gives Different Accuracy in Different Places
An algorithm that performs well in a benchmark can perform poorly in a specific deployment, and the reasons are usually mundane.
Image quality on both sides. A recognition comparison involves two images: the enrolled reference and the probe. Most deployments control one and not the other.
A high-quality enrollment portrait compared against a low-resolution overhead CCTV frame is a much harder comparison than portrait against portrait. Benchmark numbers drawn from portrait-to-portrait datasets do not apply.
Camera geometry. NIST notes that a camera not adjusted for very tall or very short subjects produces pitch-angle variation, which raises false negative rates.
That is a mounting problem, not an algorithm problem, and it falls on whoever does not match the height the installer assumed.
Exposure. Under-exposure of darker-skinned subjects and over-exposure of fairer-skinned subjects both destroy the facial detail the embedding network depends on. NIST lists inadequate lighting as a direct cause of demographic effects in false negative rates.
Camera and auto-exposure settings are part of the accuracy story. They are usually procured by a different team than the one that procured the algorithm.
Demographic differentials come from two different mechanisms
These get discussed as one problem. They are two, and they have different fixes.
False negatives vary by demographic largely because of image quality. That means they can be reduced by better capture: adjustable camera height, exposure tuned for the actual population, quality checks at enrollment.
False positives vary by demographic even when image quality is good. They arise when an algorithm’s similarity score distributions sit at different places for different groups.
NIST attributes that in part to under-representation of those groups in the data used to train the algorithm. Better cameras do not fix it. Different training data or a different algorithm does.
NIST’s demographic reporting found that in domestic mugshot imagery, false negative rates were higher for Asian and American Indian individuals than for white and Black individuals. It also found that more accurate algorithms generally show smaller differentials.
That second finding matters for procurement. Choosing a poorly performing algorithm amplifies demographic disparity as well as overall error.
NIST now publishes summary demographic indicators alongside its accuracy tables, including a worst-case to geometric-mean error ratio and a Gini coefficient. A serious evaluation reads those columns, not only the headline FNMR.
Where Face Pipelines Fail, Stage by Stage
When match rates are lower than expected, the instinct is to blame the embedding model. The cause is usually upstream.
| Stage | Typical failure | Symptom | Where to look |
|---|---|---|---|
| Capture | Inadequate resolution or exposure | Low scores across the board, worse for some groups | Inter-ocular pixel distance, exposure settings, camera height |
| Detection | Face missed, or wrong face selected in multi-face frames | Silent failures, no template generated | Detection confidence distribution, multi-face handling logic |
| Landmarks | Systematically displaced points under a specific condition | Scores drop for one pose, lighting, or accessory class | Visual overlay of predicted points on failing samples |
| Alignment | Roll not corrected, or yaw beyond correctable range | Same person scores inconsistently across sessions | Aligned crop inspection, pose estimate distribution |
| Embedding | Model trained on a population unlike the deployment’s | Consistent gap between benchmark and production accuracy | Score distributions split by demographic and capture condition |
| Matching | Threshold set on pilot gallery, applied to production gallery | Candidate lists full of strangers | Gallery size, FPIR recalculation |
| Enrollment | Poor-quality reference templates accepted into the gallery | Specific individuals never match | Per-identity quality scores at enrollment |
The enrollment row deserves emphasis. A bad enrollment template causes permanent failure for that one individual, and it stays invisible in aggregate metrics.
Enforcing a quality floor at enrollment is far cheaper than debugging it a year later.
The Training Data Behind Each Stage
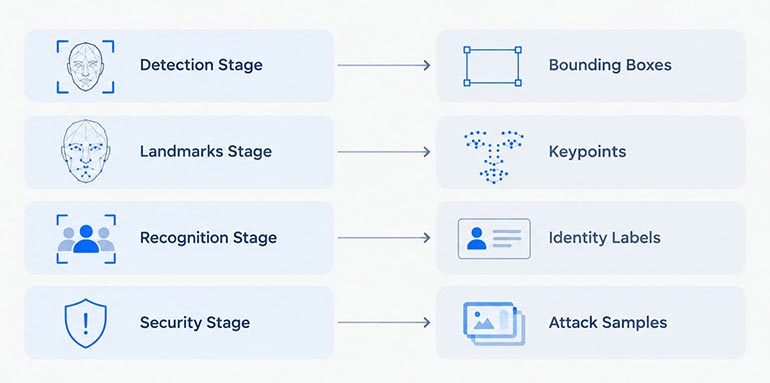
Every stage described above is a trained model, and each is trained on a different kind of labeled data. Vendor explainers leave this out entirely, and it is where most of the project cost actually sits.
| Stage | Annotation required | Typical schema | What quality means here |
|---|---|---|---|
| Detection | Bounding boxes around every face | Box coordinates, plus flags for occlusion, blur, pose, and small size | Consistent box convention; every face labeled, including hard ones |
| Landmarks | Keypoints with visibility state | 5, 68, or 98 points per face, each with visible / occluded / absent | Sub-pixel consistency between annotators on the same point |
| Identity / embedding | Identity labels across many images per person | Person ID linking multiple images under varied conditions | No identity collisions, no duplicate identities under different IDs |
| Presentation attack detection | Bona fide and attack samples, labeled by attack instrument | Attack type per sample, following ISO/IEC 30107-3 terminology | Coverage of attack instrument types, not just volume |
Four things about this table change how a project gets budgeted.
Bounding boxes are the cheapest and least decisive. Face detection is close to solved for cooperative, well-lit imagery, and good pre-trained detectors exist.
Most teams do not need a detector trained from scratch. They need one fine-tuned on their own hard cases: their camera angles, their lighting, their occlusions. That is a targeted annotation job, not a million-image one.
Landmark annotation is where precision costs money. A bounding box three pixels off is nearly harmless. A landmark three pixels off changes the alignment transform for that image.
Landmark work is priced and staffed differently for that reason, and per-image rates for keypoint tasks sit well above rates for object boxes. We break down how those annotation rates compare by technique in a separate piece.
Identity labeling is a data collection problem more than a labeling problem. Training an embedding model requires many images of the same person across time, lighting, pose, and expression.
The hard part is not drawing anything. It is assembling and verifying identity groupings without collisions, and doing it with valid consent.
For most teams, fine-tuning an existing embedding model on a modest, well-curated identity set beats training one from scratch.
Presentation attack data is the most commonly missing dataset. Teams build the pipeline, deploy it, and discover that a printed photograph or a screen replay passes.
A detector for this needs deliberately created attack samples across instrument types, labeled by type. Evaluation should be reported as APCER and BPCER per instrument, not as a single accuracy number.
Measuring landmark annotation quality
Bounding box quality is usually measured with IoU. Keypoints need a different metric.
The standard is normalized mean error: the average Euclidean distance between predicted and ground-truth points, divided by a normalizing distance so the figure is comparable across face sizes. Inter-ocular distance is the usual normalizer.
The same metric measures agreement between two annotators on the same image, which is how inter-annotator agreement is established on landmark work.
One target worth writing into a statement of work: a maximum NME between any two annotators on a shared gold-standard set, measured per landmark group rather than averaged across the face.
Averaging hides the problem. Jawline points are genuinely ambiguous and will always disagree more than eye centers.
Average them together and a jawline problem looks identical to an eye-center problem, when only one of the two affects alignment.
What Face Annotation Projects Get Wrong
These patterns recur across keypoint and facial annotation programmes, and none of them are exotic.
The guideline does not define occlusion. A face is half behind a pillar. Does the annotator place the hidden eye where they believe it is, or mark it absent?
Both are defensible. Letting each annotator decide produces a dataset where the visibility flag means different things in different batches. This single ambiguity generates more rework than anything else in keypoint projects.
Points drift over the course of a batch. Annotators place the nose tip slightly differently in week three than in week one. No individual annotation is wrong.
The aggregate carries a systematic shift, and a model trained on it inherits that shift. Periodic re-measurement against a gold-standard set catches this. A one-time calibration at kickoff does not.
Sunglasses, masks, and heavy makeup have no rule. The guideline covers the clear cases and stays silent on the ones that actually vary. Annotators then improvise, consistently within themselves and inconsistently with each other.
AI pre-labeling is trusted where it is weakest. Running a pre-trained landmark model for a first pass is efficient, and it works well on frontal, well-lit faces.
It fails in a correlated way on exactly the profile, occluded, and low-light cases the dataset was assembled to improve.
If reviewers accept pre-labels quickly because most are right, the surviving errors are the edge cases the project existed to capture.
Reviewing pre-labels needs more attention on hard samples, not less. That asymmetry is the reason human review stays in the loop on AI-assisted annotation work.
Video frames are annotated as if they were independent. For video-based face pipelines, temporal inconsistency in landmarks produces visible jitter downstream. Track-level review catches what per-frame review cannot.
Effort is estimated from the easy cases. Someone annotates twenty frontal portraits, times it, and multiplies. The real dataset is mostly not frontal portraits.
Pilot estimates should come from a sample matching the difficulty distribution of the full dataset, which usually means over-sampling the hard cases deliberately. Our guide to image annotation covers scoping and technique selection in more detail.
Legal Constraints on Face Datasets
Face data carries obligations that ordinary image data does not. This section is general information rather than legal advice, and it should prompt a conversation with counsel rather than replace one.
In the European Union, the AI Act’s Article 5 prohibitions have applied since 2 February 2025.
Those cover real-time remote bio-metric identification in publicly accessible spaces for law enforcement, subject to narrow exceptions requiring prior authorization, and untargeted scraping of facial images to build recognition databases.
Most other bio-metric identification systems fall into the Act’s high-risk tier under Annex III. The compliance deadline for that tier was originally 2 August 2026.
Regulation (EU) 2026/1744, the Digital Omnibus on AI, entered into force on 27 July 2026 and moved it to 2 December 2027. Systems embedded in products regulated under Annex I moved to 2 August 2028.
The obligations themselves were not removed. Guidance written before mid-2026 still states the old dates, so check any deadline you find against a current source.
Retrospective, non-real-time bio-metric identification was not prohibited. It is classified as high-risk, which brings conformity assessment, documentation, human oversight, and registration obligations rather than a ban.
GDPR applies independently of the AI Act. Bio-metric data processed to uniquely identify a person is a special category under Article 9, requiring a lawful basis under Article 6 plus a condition under Article 9.
The United States has no federal bio-metric privacy statute. Illinois’ Biometric Information Privacy Act is the most consequential state law because it provides a private right of action, and several other states have enacted bio-metric provisions of varying scope.
For dataset work specifically, three questions decide whether a face dataset is usable. Was consent obtained for this purpose? Is there a documented retention and deletion path? Can the provenance of every image be demonstrated?
Datasets assembled by scraping public images fail at least one of those in most jurisdictions, however freely available the images were.
Questions to Ask a Vendor
If you are evaluating a face recognition product rather than building one, these separate a real answer from a data sheet.
- What is your FNMR at a stated FMR, on which dataset, and has the algorithm been submitted to NIST’s evaluation?
- What gallery size was your accuracy figure measured against, and what is the FPIR at our gallery size?
- What demographic differential measures do you report, and against what population?
- What minimum image quality does the system enforce at enrollment, and what happens to a capture below it?
- Has your presentation attack detection been tested against ISO/IEC 30107-3, at what level, and by whom?
- Is the template format proprietary, and what happens to our enrolled gallery if we change vendors?
- What is stored: images, templates, or both, and for how long?
Question two is the one that most often produces a pause.
Where This Leaves You
The pipeline is five stages, and the interesting failures are rarely in the stage people expect.
Detection and alignment quality set the ceiling. Matching arithmetic decides whether the system scales. Training data decides how the models behave on the faces that are not in the benchmark.
If you are assembling the datasets behind a face pipeline, landmark and identity work is where precision requirements bite hardest, and where a vague annotation guideline turns into months of rework.
A pilot on a sample of your own hard cases is the fastest way to learn what your real annotation rate looks like.
Frequently Asked Questions
Face detection finds where a face is and returns a bounding box. Facial recognition determines whose face it is, by converting the face into a numerical template and comparing it against stored templates. Detection runs first.
A fixed-length vector of numbers produced by a neural network from an aligned face image, commonly 128 or 512 dimensions. Same-person images produce vectors close together; different people produce vectors further apart. The embedding, not the photograph, is compared.
Recognition itself usually uses five: both eye centers, the nose tip, and both mouth corners. Those are enough to rotate, scale, and crop the face into a standard position. Denser schemes of 68, 98, or 468 points serve expression analysis and AR.
There is no universal value, and any vendor offering one has not asked about your deployment. It follows from which error you can tolerate and how many identities are enrolled. Measure it on your own imagery at production gallery size.
A 1:1 comparison makes one decision. A 1:N search makes one per enrolled identity, and each can produce a false match. False positive rate rises with gallery size, so a threshold tuned on a thousand identities floods a ten-million gallery.
There is no single number. Accuracy depends on the algorithm, image quality on both sides, the threshold, and the population. NIST reports false non-match rates at fixed false match rates, and the spread across submitted algorithms is large.
Four datasets, not one. Bounding boxes for the detector, keypoints with visibility flags for the landmark model, identity labels across many images per person for the embedding model, and labeled attack samples for liveness detection.
Not directly, and not trivially. Research on template inversion has shown approximate reconstructions are achievable under some conditions, so a template is not anonymized data. Privacy regimes classify bio-metric templates as personal data.
Let us label a pilot sample of your most challenging cases.
Get started with a free pilot. »

Biju Peter is a Senior Project Manager with 22+ years in the BPM industry, specializing in large-scale data operations and annotation-driven projects. He brings deep expertise in data processing, web research, scraping, and multi-modal annotation across image, text, audio, and video domains. He has successfully led 200+ projects, managed large teams, and delivered scalable, high-quality solutions for global AI and machine learning initiatives for clients across the globe. 🔗Connect with Biju on LinkedIn